How to set up Kubernetes service discovery in Prometheus
NextCommit.careers
https://nextcommit.careers/Elevate your DevOps & infrastructure career! Embrace remote possibilities and shape the future of tech. Discover job openings now and ignite your journey to success!
The ability to monitor production services is fundamental to both understand how the system behaves, troubleshoot bugs and incidents, and try to prevent them from happening. In this post we’re going to cover how Prometheus can be installed and configured in a Kubernetes cluster so that it can automatically discover the services using custom annotations. We’ll start by providing an overview of Prometheus and its capabilities. After that, we’ll deep-dive into how to configure auto-discovery and we'll conclude with the monitoring of a sample application in action.
To test what follows you need a Kubernetes cluster. For local testing, I’d recommend using minikube that lets you install a Kubernetes cluster on your local machine. Otherwise, feel free to use any other Kubernetes provider out there, I personally use GKE.
The content of this post has been tested on the following environments:
- Locally:
minikube v1.25.1kubectl:- client:
v1.23.3 - server:
v1.23.1
- client:
- GKE:
kubectl:- client:
v1.21.9 - server:
v1.21.9
- client:
All the code shown here Is available on Github.
Let’s get started!

What is Prometheus?
Prometheus is an open-source software for monitoring your services by pulling metrics from them through HTTP calls. These metrics are exposed using a specific format, and there are many client libraries written in many programming languages that allow exposing these metrics easily. On top of that, there are also many existing so-called exporters that allow third-party data to be plumbed into Prometheus.
Prometheus is an end-to-end monitoring solution as it provides also configurable alerting, a powerful query language, and a dashboard for data visualization.
Data model and Query Language
The data model implemented by Prometheus is highly dimensional. All the data are stored as time series identified by a metric name and a set of key-value pairs called labels:
<metric name>{<label_1 name>=<label_1 value>, ..., <label_n name>=<label_n value>} <value>
Each sample of a time series consists of a float64 value and a millisecond-precision timestamp.
As an example borrowed from the official documentation if we want to expose a metric that counts the HTTP requests it can be expressed as:
api_http_requests_total{method=<method>, handler=<handler>} <value>
In the case of POST requests to a /messages endpoint that has been called 3 times, it becomes:
api_http_requests_total{method="POST", handler="/messages"} 3.0
If we assume that we track only for methods “POST” and “GET” and for handlers “/messages” and the root “/”, in Prometheus this corresponds to four distinct time series:
api_http_requests_totalwithmethod=“GET”andhandler="/"api_http_requests_totalwithmethod=“GET”andhandler="/messages"api_http_requests_totalwithmethod=“POST”andhandler="/"api_http_requests_totalwithmethod=“POST”andhandler="/messages"
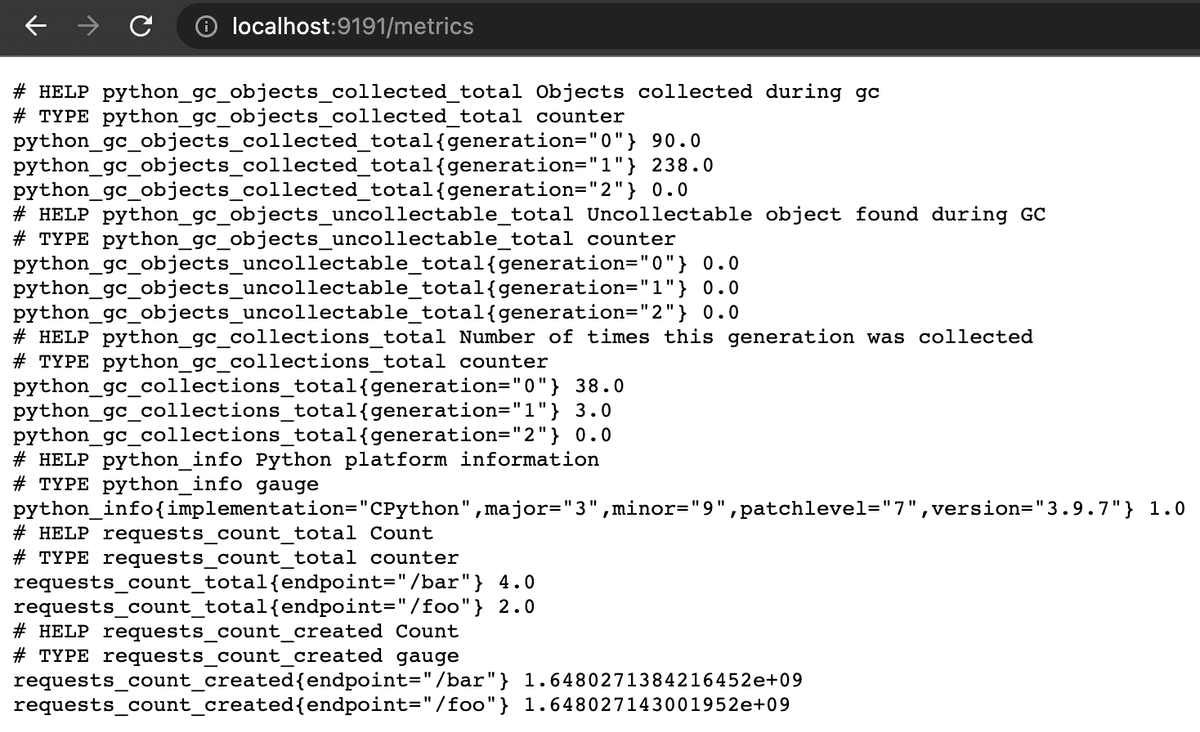
Here’s a screenshot of the metrics exposed by the sample application that we’ll see in more detail in the next sections:
As you can see there’s a requests_count_total that counts the number of requests for two endpoints, /foo and /bar, along with some other default metrics automatically exported by the client.
Architecture
Prometheus consists of multiple components as you can see from the documentation. Many of them are optional, and for what concerns what we’re covering in this post we have:
- the main Prometheus server that scrapes and stores the times series data by pulling them,
- the service discovery that discovers the Kubernetes targets,
- the Prometheus web UI for querying and visualizing the data.
Prometheus in Kubernetes
Let’s now have a look at how to install Prometheus in Kubernetes! In order to do it, there are many Kubernetes objects needed, we’ll have a look at each of them to understand exactly what we’re shipping.
Alternatively to the “manual” installation that we’re showing here, you can also install Prometheus with Helm. Helm is like a package manager, but for Kubernetes components. It has the advantage of making things easier, but it hides all the details of what is being shipped under the hood and the goal of this post is to dissect exactly what lies underneath.
Namespace
Nothing fancy here, we’re just going to have our Prometheus application running in the monitoring namespace.
apiVersion: v1
kind: Namespace
metadata:
  name: monitoring
Service account and RBAC
For Prometheus to discover the pods, services, and endpoints in our Kubernetes cluster, it needs some permissions to be granted. By default, a Kubernetes pod is assigned with a default service account in the same namespace. A service account is simply a mechanism to provide an identity for processes that run in a Pod. In our case, we’re going to create a prometheus service account that will be granted some extra permissions.
apiVersion: v1
kind: ServiceAccount
metadata:
  namespace: monitoring
  name: prometheus
One of the ways Kubernetes has for regulating permissions is through RBAC Authorization. The RBAC API provides a set of Kubernetes objects that are used for defining roles with corresponding permissions and how those rules are associated with a set of subjects. In our specific case, we want to grant to the prometheus service account (the subject) the permissions for querying the Kubernetes API to get information about its resources (the rules). This is done by creating a ClusterRole Kubernetes object.
apiVersion: rbac.authorization.k8s.io/v1
kind: ClusterRole
metadata:
  name: discoverer
rules:
- apiGroups: [""]
  resources:
  - nodes
  - services
  - endpoints
  - pods
  verbs: ["get", "list", "watch"]
- apiGroups:
  - extensions
  resources:
  - ingresses
  verbs: ["get", "list", "watch"]
Check the documentation if you want to know about the difference between Role and ClusterRole.
As you might have guessed from the yaml definition, we’re creating a role called discoverer that has the permissions to perform the operations:
get,list,watch,
over the resources:
nodes,services,endpoints,pods.
These are enough for what is covered by this post, but depending on what you’re going to monitor you might need to extend the permissions granted to the discoverer role by adding other rules. Here you can see the possible verbs that can be used.
To recap: now we have the promethues ServiceAccount as our subject and we have our discoverer ClusterRole carrying the rules. The only missing thing is to bind the discoverer role to the prometheus service account and this can be easily done using a ClusterRoleBinding.
apiVersion: rbac.authorization.k8s.io/v1
kind: ClusterRoleBinding
metadata:
  name: prometheus-discoverer
roleRef:
  apiGroup: rbac.authorization.k8s.io
  kind: ClusterRole
  name: discoverer
subjects:
- kind: ServiceAccount
  name: prometheus
  namespace: monitoring
The yaml is very straightforward: we’re assigning the role defined in roleRef, which in this case is the ClusterRole named discoverer that we previously defined, to the subjects listed in subjects which for us is only the prometheus ServiceAccount.
All permissions are set!

Deployment and Service
Now the easy part: the Deployment and the Service objects!
They’re both very straightforward. The deployment has a single container running Prometheus v2.33.4 and has a ConfigMap mounted that we’ll see in detail in the next section. It also assigns the previously defined service account and it exposes port 9099 that will be used to see the Prometheus web application.
apiVersion: apps/v1
kind: Deployment
metadata:
  name: prometheus
  namespace: monitoring
  labels:
    app: prometheus
spec:
  replicas: 1
  selector:
    matchLabels:
      app: prometheus
  template:
    metadata:
      labels:
        app: prometheus
    spec:
      serviceAccountName: prometheus
      containers:
      - name: prometheus
        image: prom/prometheus:v2.33.4
        ports:
        - containerPort: 9090
        volumeMounts:
          - name: config
            mountPath: /etc/prometheus
      volumes:
        - name: config
          configMap:
            name: prometheus-server-conf
The Service object as well doesn’t have anything special and it simply exposes port 9090.
apiVersion: v1
kind: Service
metadata:
  name: prometheus
  namespace: monitoring
spec:
  selector:
    app: prometheus
  ports:
  - port: 9090
ConfigMap
Here’s the hard part!

In Prometheus, the configuration file defines everything related to scraping jobs and their instances. In the context of Prometheus, an instance is an endpoint that can be scraped, and a job is a collection of instances with the same purpose. For example, if you have an API server running with 3 instances, then you could have a job called api-server whose instances are the host:port endpoints.
Let’s now deep dive into how to write the configuration file to automatically discover Kubernetes targets!
Prometheus has a lot of configurations, but for targets discovery, we’re interested in the scrape_configs configuration. This section describes the set of targets and parameters and also how to scrape them. In this post we’re only interested in automatically scraping the Kubernetes services, so we’ll create a single entry for scrape_configs.
Let’s see how the final ConfigMap looks like and then we’ll go through each relevant part.
apiVersion: v1
kind: ConfigMap
metadata:
  name: prometheus-server-conf
  namespace: monitoring
  labels:
    name: prometheus-server-conf
data:
  prometheus.yml: |-
    scrape_configs:
      - job_name: 'kubernetes-service-endpoints'

        scrape_interval: 1s
        scrape_timeout: 1s

        kubernetes_sd_configs:
        - role: endpoints

        relabel_configs:
        - source_labels: [__meta_kubernetes_service_annotation_se7entyse7en_prometheus_scrape]
          action: keep
          regex: true
        - source_labels: [__meta_kubernetes_service_annotation_se7entyse7en_prometheus_scheme]
          action: replace
          target_label: __scheme__
          regex: (https?)
        - source_labels: [__meta_kubernetes_service_annotation_se7entyse7en_prometheus_path]
          action: replace
          target_label: __metrics_path__
          regex: (.+)
        - source_labels: [__address__, __meta_kubernetes_service_annotation_se7entyse7en_prometheus_port]
          action: replace
          target_label: __address__
          regex: ([^:]+)(?::\d+)?;(\d+)
          replacement: $1:$2
        - source_labels: [__meta_kubernetes_namespace]
          action: replace
          target_label: kubernetes_namespace
        - source_labels: [__meta_kubernetes_service_name]
          action: replace
          target_label: kubernetes_service
        - source_labels: [__meta_kubernetes_pod_name]
          action: replace
          target_label: kubernetes_pod
As anticipated, there’s only a job in scrape_configs that is called kubernetes-service-endpoints. Along with the job_name, we have scrape_interval that defines how often a target for this job has to be scraped, and then we have scrape_timeout that defines the timeout for each scrape request.
The interesting part comes now. The kubernetes_sd_configs configuration describes how to retrieve the list of targets to scrape using the Kubernetes REST API. Kubernetes has a component called API server that exposes a REST API that lets end-users, different parts of your cluster, and external components communicate with one another.
To discover targets, multiple roles can be chosen. In our case, we chose the role endpoints as that covers the majority of the cases. There are many other roles such as node, service, pod, etc., and each of them discovers targets differently, for example (quoting the documentation):
- the
noderole discovers one target per cluster node, - the
servicerole discovers a target for each service port for each service, - the
podrole discovers all pods and exposes their containers as targets, - the
endpointsrole discovers targets from listed endpoints of a service. If the endpoint is backed by a pod, all additional container ports of the pod, not bound to an endpoint port, are discovered as targets as well, - etc.
As you can see it should cover the majority of the cases. I’d invite you to have a deeper look at the documentation here.
The difference between roles is not only in how targets are discovered but also in which labels are automatically attached to those targets. For example, with role node each target has a label called __meta_kubernetes_node_name that contains the name of the node object, which is not available with role pod. With role pod each target has a label called __meta_kubernetes_pod_name that contains the name of the pod object, which is not available with role node. If you think about it, it’s obvious, because if your target is a node it doesn’t have any pod name simply because it’s not a pod and vice versa.
The nice thing about the role endpoints is that Prometheus provides different labels depending on the target: if it’s a pod, then the labels provided are those of the role pod, if it’s a service, then those of the role service. In addition, there’s also a set of extra labels that are available independently from the target.
After this introduction, we’re ready to tackle the relabel_config configuration.
relabel_config
Let’s recall for a moment what’s our final goal: we’d like Kubernetes services to be discovered automatically by Prometheus using custom annotations. We want something that will look like this:
  annotations:
    prometheus.io/scrape: "true"
    prometheus.io.scheme: "https"
    prometheus.io/path: "/metrics"
    prometheus.io/port: "9191"
This would mean that the corresponding Kubernetes object will be scraped thanks to the annotation prometheus.io/scrape value of true, that the metrics can be reached at port 9191 at path /metrics. It is worth noticing that the name of the annotation can be anything you want. To showcase this, we’ll then use the followings:
  annotations:
    se7entyse7en.prometheus/scrape: "true"
    se7entyse7en.prometheus/scheme: "https"
    se7entyse7en.prometheus/path: "/metrics"
    se7entyse7en.prometheus/port: "9191"
As previously mentioned, each target that is scraped comes with some default labels depending on the role and on the type of target. The relabel_config provides the ability to rewrite the set of labels of a target before it gets scraped.
What does this mean? Let’s say for example that thanks to our kubernetes-service-endpoints scraping job configured with role: endpoints Prometheus discovers a Service object by using the Kubernetes API. For each target, the list of rules in relabel_config is applied to that target.
Let’s consider a service as follows:
apiVersion: v1
kind: Service
metadata:
  name: app
  annotations:
    se7entyse7en.prometheus/scrape: "true"
    se7entyse7en.prometheus/scheme: "https"
    se7entyse7en.prometheus/path: "/metrics"
    se7entyse7en.prometheus/port: "9191"
spec:
  selector:
    app: app
  ports:
  - port: 9191
Let’s now try to apply each relabelling rule one by one to really understand what Prometheus does. Again, when applying the relabelling rules, Prometheus has just discovered the target, but it didn’t yet scrape the metrics. Indeed, we’ll now see that the way the metrics are going to be scraped, will depend on the relabelling rules. For a full reference of relabel_config see here.
But no more talk and let's see it in practice!
To scrape or not to scrape
The first rule controls whether the target has to be scraped at all or not:
        - source_labels: [__meta_kubernetes_service_annotation_se7entyse7en_prometheus_scrape]
          action: keep
          regex: true
As you can see the source_labels is a list of labels. This list of labels is first concatenated by using a separator that can be configured and that is ; by default. Given that in this rule there’s only one item, there’s no concatenation happening.
By reading the documentation, we can see that for the role: service there’s a meta label called __meta_kubernetes_service_annotation_<annotationname> that maps to the corresponding (slugified) annotation in the service object. In our example then, the concatenated source_labels is simply equal to the string true thanks to se7entyse7en.prometheus/scrape: "true".
The action: keep makes Prometheus ignore all the targets whose concatenated source_labels don’t match the regex that in our case is equal to true. Since according to our example the regex true matches the value true, the target is not ignored. Don't confuse true with being a boolean here, you can even decide to use a regex that matches an annotation value of "yes, please scrape me".
Where are the metrics?
The second rule controls what is the scheme to use when scraping the metrics from the target:
        - source_labels: [__meta_kubernetes_service_annotation_se7entyse7en_prometheus_scheme]
          action: replace
          target_label: __scheme__
          regex: (https?)
According to previous logic, the concatenated source_labels is equal to https thanks to the se7entyse7en.prometheus/scheme: "https" annotation. The action: replace replaces the label in target_label with the concatenated source_labels if the concatenated source_labels matches the regex. In our case, the regex (https?) matches the concatenated source_labels that is https. The outcome is that the label __scheme__ now has the value of https.
But what is the label __scheme__? The label __scheme__ is a special one that indicates to Prometheus what is the URL that should be used to scrape the target's metrics. After the relabelling, the target's metrics will be scraped at __scheme__://__address____metrics_path__ where __address__ and __metrics_path__ are two other special labels similarly to __scheme__. The next rules will indeed deal with these.
The third rule controls what is the path that exposes the metrics:
        - source_labels: [__meta_kubernetes_service_annotation_se7entyse7en_prometheus_path]
          action: replace
          target_label: __metrics_path__
          regex: (.+)
This rule works exactly like the previous one, the only difference is the regex. With this rule, we replace __metrics_path__ with whatever is in our custom Kubernetes annotation. In our case, it will be then equal to /metrics thanks to the se7entyse7en.prometheus/path: "/metrics" annotation.
The fourth rule finally controls the value of __address__ that is the missing part to have the final URL to scrape:
        - source_labels: [__address__, __meta_kubernetes_service_annotation_se7entyse7en_prometheus_port]
          action: replace
          target_label: __address__
          regex: ([^:]+)(?::\d+)?;(\d+)
          replacement: $1:$2
This rule is very similar to the previous ones, the differences are that it also has a replacement key and that we have multiple source_labels. Let’s start with the source_labels. As previously explained, the values are concatenated and the separator ; is used. By default the label __address__ has the form <host>:<port> and is the address that Prometheus used to discover the target. I don’t know exactly what port is used for that purpose, but it's not important for our goal, so let’s just assume that is 1234 and that the host is something like se7entyse7en_app_service. Thanks to the se7entyse7en.prometheus/port: "9191" annotation, we obtain that the concatenated source_labels is equal to: se7entyse7en_app_service:1234;9191. From this string, we want to keep the host but use the port coming from the annotation. The regex and the replacement configurations are exactly meant for this: the regex uses 2 capturing groups, one for the host, and one for the port, and the replacement is set up in a way so that the output is $1:$2 that corresponds to the captured host and port separated by :.
So now we finally have __scheme__, __address__ and __metrics_path__! We said that the target URL that will be used for scraping the metrics is given by:
__scheme__://__address____metrics_path__
If we replace each part we have:
https://se7entyse7en_app_service:9191/metrics
Extra labels
The remaining rules are simply adding some default labels to the metrics when they'll be stored:
        - source_labels: [__meta_kubernetes_namespace]
          action: replace
          target_label: kubernetes_namespace
        - source_labels: [__meta_kubernetes_service_name]
          action: replace
          target_label: kubernetes_service
        - source_labels: [__meta_kubernetes_pod_name]
          action: replace
          target_label: kubernetes_pod
In this case, we're adding the labels kubernetes_namespace, kubernetes_service, and kubernetes_pod from the corresponding meta labels.
To recap, these are the steps to automatically discover the targets to scrape with the configured labels:
- Prometheus discovers the targets using the Kubernetes API according to the
kubernetes_sd_configconfiguration, - Relabelling is applied according to
relabel_config, - Targets are scraped according to special labels
__address__,__scheme__,__metrics_path__, - Metrics are stored with the labels according to
relabel_configand all the labels starting with__are stripped.
Sample Application
To see Kubernetes service discovery of Prometheus in action we need of course a sample application that we want to be automatically discovered.
The sample application is very simple. It’s a Python API server that exposes a /foo and a /bar endpoint. Then the /metrics endpoint exposes the metrics that we’ll be pulled and collected by Prometheus.
For the sake of keeping things easy, there’s only a metric that counts the number of requests with the label endpoint.
Code
I wrote a very simple Python server that does exactly what was mentioned above:
/foo: returns status code 200, and shows the current counter value for/foo,/bar: returns status code 200, and shows the current counter value for/bar,/metrics: returns the metrics in the format suitable for Prometheus,- everything else returns 404.
import http.server

from prometheus_client import Counter, exposition

COUNTER_NAME = 'requests_count'
REQUESTS_COUNT = Counter(COUNTER_NAME, 'Count', ['endpoint'])

class RequestsHandler(exposition.MetricsHandler):

    def do_GET(self):
        if self.path not in ('/foo', '/bar', '/metrics'):
            self.send_response(404)
            self.send_header('Content-type', 'text/plain')
            self.end_headers()
            self.wfile.write('404: Not found'.encode())
            return

        if self.path in ('/foo', '/bar'):
            REQUESTS_COUNT.labels(endpoint=self.path).inc()
            current_count = self._get_current_count()
            self.send_response(200)
            self.send_header('Content-type', 'text/plain')
            self.end_headers()
            self.wfile.write(
                f'Current count: [{self.path}] {current_count}'.encode())
        else:
            return super().do_GET()

    def _get_current_count(self):
        sample = [s for s in REQUESTS_COUNT.collect()[0].samples
                  if s.name == f'{COUNTER_NAME}_total' and
                  s.labels['endpoint'] == self.path][0]
        return sample.value


if __name__ == '__main__':
    for path in ('/foo', '/bar'):
        REQUESTS_COUNT.labels(endpoint=path)

    server_address = ('', 9191)
    httpd = http.server.HTTPServer(server_address, RequestsHandler)
    httpd.serve_forever()
The only dependency is prometheus_client which provides the utilities for tracking the metrics, and exposing them in the format required. Prometheus provides clients for many programming languages, and you can have a look here.
Dockerfile
The Dockerfile is very straightforward as well: it simply installs Poetry as the dependency manager, installs them, and sets the CMD to simply execute the server.
FROM python:3.9

WORKDIR /app

RUN pip install poetry
COPY pyproject.toml .
RUN poetry config virtualenvs.create false && poetry install
COPY ./sample_app ./sample_app

CMD [ "python", "./sample_app/__init__.py" ]
Deployment and Service
The deployment object for the sample app is straightforward: it has a single container and exposes port 9191.
apiVersion: apps/v1
kind: Deployment
metadata:
  name: app
  labels:
    app: app
spec:
  replicas: 1
  selector:
    matchLabels:
      app: app
  template:
    metadata:
      labels:
        app: app
    spec:
      containers:
      - name: app
        image: sample-app:latest
        imagePullPolicy: Never
        ports:
        - containerPort: 9191
You might have noticed that the imagePullPolicyis set to Never. This is simply because when testing locally with minikube I’m actually building directly the image inside the container and this avoids Kubernetes to try looking for the image from a remote registry. When running this on a remote Kubernetes cluster, you'll need to remove it and make the image available from a registry.
There are many ways to provide a Docker image to the local minikube cluster. In our case you can do it as follows:
cd sample-app && minikube image build --tag sample-app .
The service object is straightforward as well, but here we can see the annotations in actions as explained in the previous sections.
apiVersion: v1
kind: Service
metadata:
  name: app
  annotations:
    se7entyse7en.prometheus/scrape: "true"
    se7entyse7en.prometheus/path: "/metrics"
    se7entyse7en.prometheus/port: "9191"
spec:
  selector:
    app: app
  ports:
  - port: 9191
Action!
Let's move to the fun part now!

I'm assuming that you have a Kubernetes cluster up and running either locally, or in any other way you prefer. Let's start by deploying the namespace first for Prometheus and then by deploying everything else:
kubectl apply -f kubernetes/prometheus/namespace.yaml && \
  kubectl apply -f kubernetes/prometheus/
At some point you should be able to see your Prometheus deployment up and running:
kubectl get deployment --namespace monitoring
We should now be able to access the Prometheus web UI. In order to access it, you can port-forward the port:
kubectl port-forward --namespace monitoring deployment/prometheus 9090:9090
If you go to localhost:9090 you should see be able to see it and play with it! But until you don't deploy the sample application there's actually not much to do, indeed if you check the target section at http://localhost:9090/targets you'll see that there are no targets.
Ok, let's fix this! Let's now deploy the sample application:
kubectl apply -f kubernetes/app/
As previously mentioned, if you're using minikube, you'd need to provide the image to your local cluster unless you pushed it in some registry similarly to how you'd usually do in a production environment.
Now you should be able to see the deployment of the sample application up and running as well:
kubectl get deployment
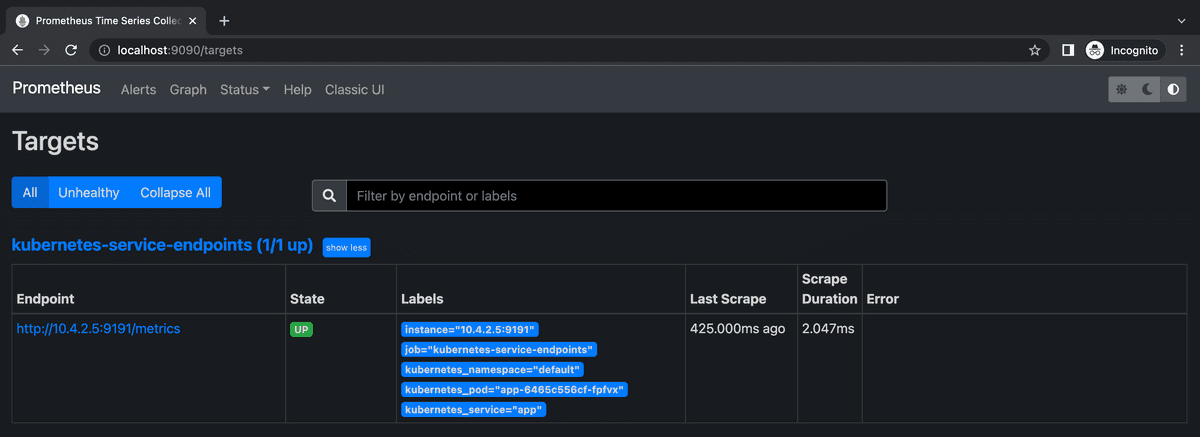
If you now go to the list of Prometheus targets you should see that your sample app has been automatically discovered!
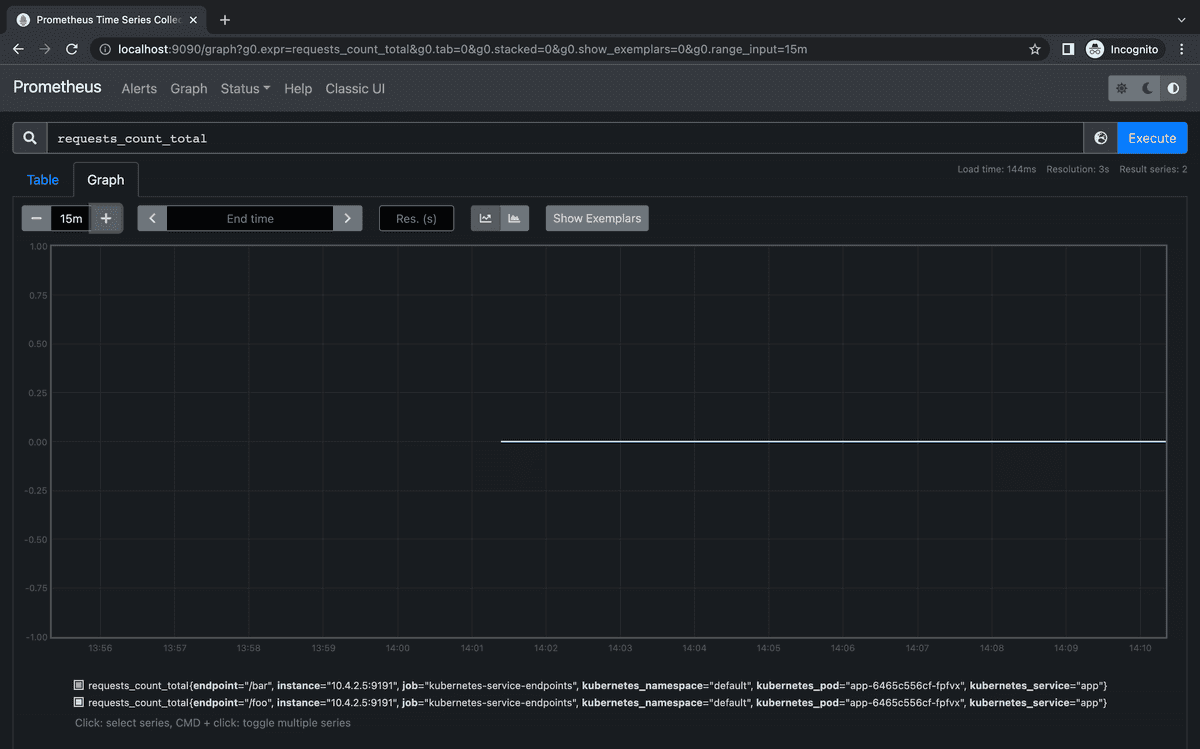
We can now query the metrics from the graph section at http://localhost:9090/graph and ask for the requests_count_total metric. You should be able to see two metrics: one for endpoint /foo and the other one for endpoint /bar, both at 0.
Let's try to call those endpoints then and see what happens! Let's first set up the port-forward to the sample app:
kubectl port-forward deployment/app 9191:9191
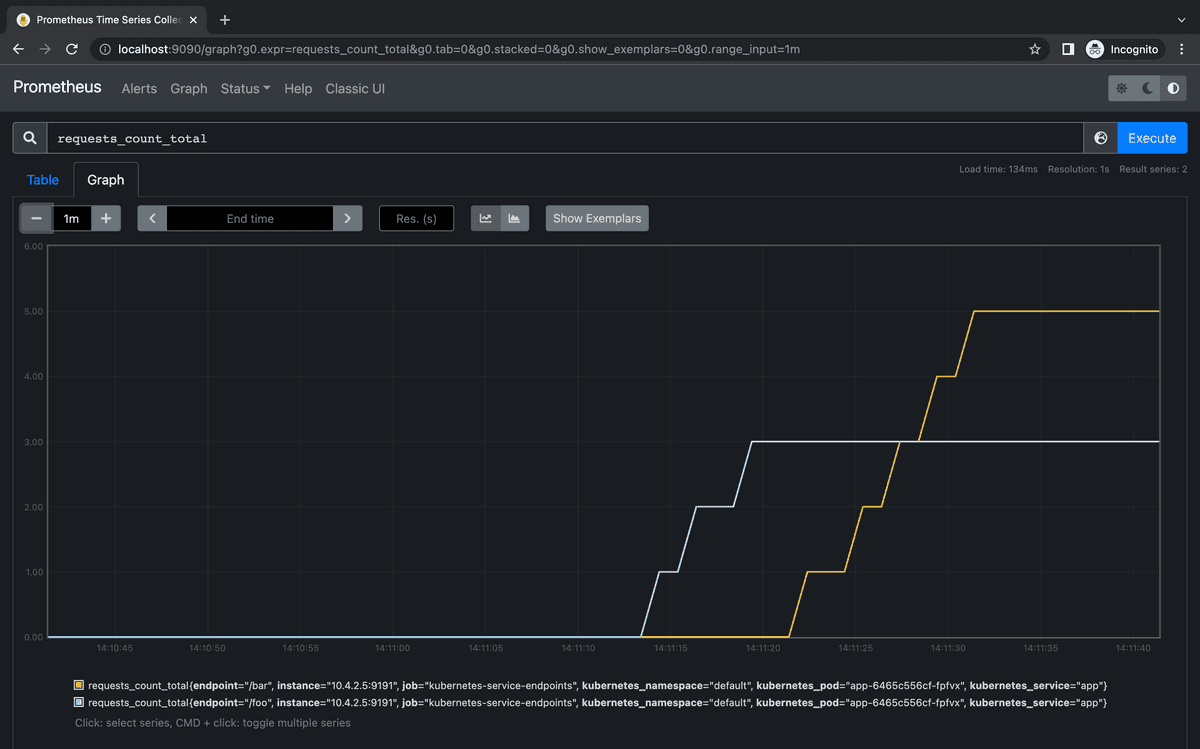
Now let's call 3 times /foo and 5 times /bar, and you can do it simply by curl-ing:
curl localhost:9191/foo  // 3 times
curl localhost:9191/bar  // 5 times
Lets's check the graph again:
Hurray! The metrics are ingested as expected to Prometheus with the proper labels!

NextCommit.careers
https://nextcommit.careers/Elevate your DevOps & infrastructure career! Embrace remote possibilities and shape the future of tech. Discover job openings now and ignite your journey to success!
Conclusions
In this post, we covered how to automatically discover Prometheus targets to scrape with Kubernetes service discovery. We went in-depth through all the Kubernetes objects by putting particular attention on RBAC authorization and on the semantic of Prometheus configuration. We've finally been able to see everything in action by deploying a sample application that has been successfully discovered automatically.
Having a properly monitored infrastructure in a production environment is fundamental to ensure both the availability and the quality of a service. It's easy to assess that being able to automatically discover new targets as new services are being added makes this task easier.
In addition, being able to expose metrics to Prometheus is also useful for other tasks such as alerting, and also to enable autoscaling through Kubernetes HPA using custom metrics, but these are all topics that would need a separate post.
I hope that this post has been useful and if you have any comments, suggestions, or need any clarification feel free to comment!


